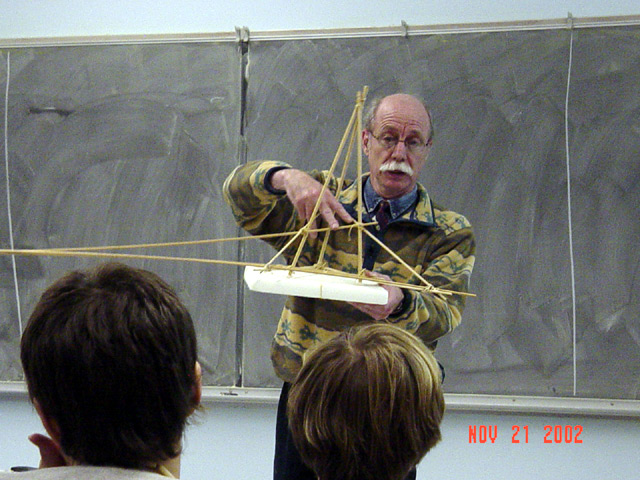
Professor Emeritus of Mathematics
Fall, 2017 - Spring, 2020, Fall, 2021- Spring, 2022:Visitor to University of Arizona Mathematics Department, Tucson, AZ.
Find
out about the Sensible Calculus Program (
Older Version.)
Mapping Diagrams from A(lgebra)
B(asics) to C(alculus) and D(ifferential) E(quation)s. A Reference and Resource Book on Function Visualizations
Using Mapping Diagrams (In Development-Draft Version 8-2017)
Papers/Presentations/etc. [2019-2022]
BEAM Summer Away, LaVerne University, LaVerne, CA, two one week courses, July 5-19, 2022.
Mathematics Instruction Colloquium, University of Arizona. "GeoGebra: Why I Use It. Should You?".(GeoGebra Book) April 4, 2022.
ArizMATYC/MAA
Southwestern Section Joint Conference, "Visualizing Linear and
Nonlinear Functions and Transformations of Several Variables with
Mapping Diagrams"
ASU Polytechnic Campus, April 1, 2022 (GeoGebra Book: https://flashman.tiny.us/ArizMATYC)
Mathematics Educator Appreciation Day (MEAD).(Links)
Visualizing Calculus With Mapping Diagrams: Making Sense Of Differentiation And Integration.Tucson, AZ. January 22,2022.
CMC-South Annual Conference 2021, "Visualizing the Algebra of Equations with Mapping Diagrams". November 6, 2021. (Links)
14th International Congress on Mathematical Education, "MAPPING DIAGRAMS: FUNCTION VISUALIZATION OF REAL AND COMPLEX ANALYSIS AND MATRIX ALGEBRA", Shanghai, July 14, 2021. Topic Study Group 23 Visualization in the teaching and learning of mathematics (GeoGebra Book includes Paper)
(On YouTube)
ATM Conference 2021. "Visualizing the algebra of equations and inequalities with mapping diagrams", April 7 & 8,2021. (Links)
AMATYC
Webinar, "Visualizing Solving Equations with Function Mapping Diagrams" September 22, 2020. (On YouTube.)
Joint Mathematics Meetings Denver, CO Jan. 15&17, 2020: MAA Minicourse 2020: Visual Complex Analysis- GeoGebra Tools and Mapping Diagrams GeoGebra Book.
HSU Math Department Colloquium,"Linear Algebra & Mapping Diagrams: Old & New Visualizations" (GeoGebra Book) Sept. 5, 2019.
Proceedings
of Bridges 2019: Mathematics, Art, Music, Architecture, Education,
Culture, Edited by Goldstine, McKenna, and Fenyvesi, July, 2019, pp
295-302.
"Mapping Diagrams and a New Visualization of Complex Functions with GeoGebra"
Mapping Diagrams and Visualization of Complex Function. GeoGebra book, https://ggbm.at/gutmhcp8, July, 2019.
MEI Conference 2019 (Bath, UK), Saturday, June 29, 2019.[Links]
"Visualizing Functions with Mapping Diagrams"
"Visualizing Calculus with Mapping Diagrams"
ICTCM 2019 (Scottsdale, AZ). Saturday, March 16, 2019. [Links]
"GeoGebra Tools for Visualizing Integration with Mapping Diagrams"
"GeoGebra Tools for Creating Mapping Diagrams: From Worksheets to Books"
Recent (back to 2011) Stuff.
Not So Recent (before 2011) Stuff.
Miscellaneous:
My Bookmarks (old)
A resume.(pdf) ;
A biographical sketch.
POM SIGMAA (Philosophy of
Mathematics) Find out more about this Special
Interest Group of the MAA.
HOM
SIGMAA
(History of Mathematics) Find out more about
this Special Interest Group of the MAA.
*
WORK IN PROGRESS (7-13-2019)
This site is still under
reorganization. It is now moved from a server at Humboldt State University to one at neocities.org.
Links are being reconfigured and some are inactive or
incorrect.
Older pages need reworking to be made handicapped
accessible.
Links starting with "users,humboldt.edu/flashman" are being
readdressed as needed with "flashman.neocities.org"
I continue to work on this.
Flash :)


