| [The Dart Model] Suppose you are
throwing a dart at a region in the plane and measuring a random variable
X determined by the position of the dart. X has values only between 0 and
10. Unfortunately you are not given the distribution function of X. [Recall
that for any real number A between 0 and 10 the distribution function F,
would give you F(A), the probability that the value of X is less than or
equal to A.]
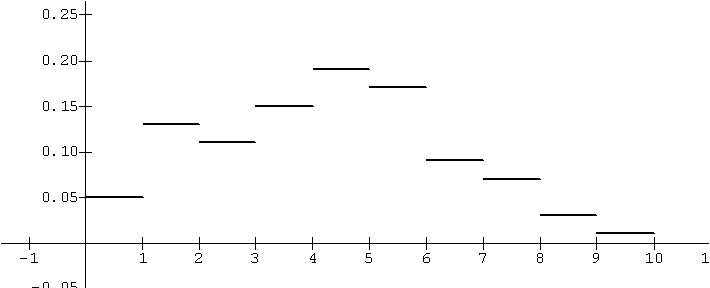
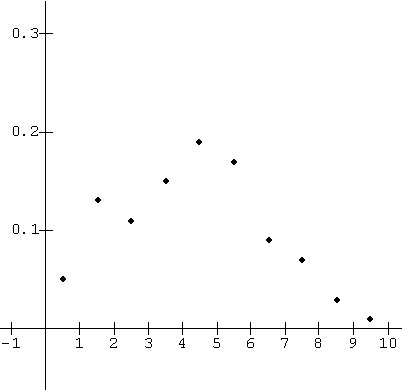
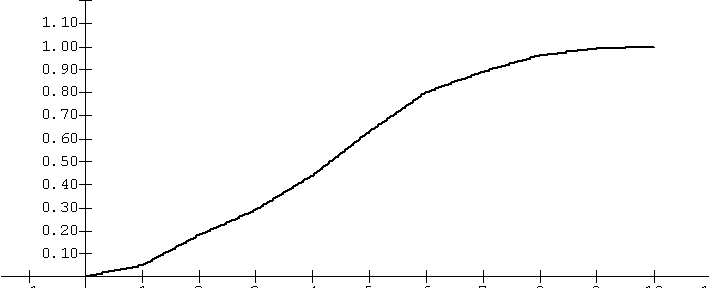
Instead you have been given a graph, an algebraic expression and a table for the probability density function of X. [Recall that for any real number A between 0 and 10 the probability density function of X, f, gives you f(A), the derivative of F at A, which is approximately the ratio of the probability of the random variable X being in an interval [A, A+h] to the length of that interval, h.] Based on this information do you think you could estimate the probability that the value of X being less 5? Recognizing that F(0) = 0 and F(10) = 1, could you estimate F(A) for any A between 0 and 10? As a practical matter, you might break the interval into10 pieces of equal length and then estimate the probability of X being in each of those interval from the density of X at some point in that interval. Then for A, just add up the probability estimates for X being in an interval that has values less than or equal to A. |
|
 |
||||||||||||||||||||||||||||||||||||||||||||
|
Solution: As suggested, consider the interval [0,10] broken into smaller intervals each of length 1, i.e., [0,1], [1,2], [2,3], ... , [8,9], and [9,10]. Since each of these intervals has length 1, we can use f (A) as an estimate for the probability of the dart falling in the inteval that contains A. So, for example we estimate the probability that X lies in the interval [0,1] with f (.5) = .05, while we estimate the probability that X lies in the interval [1,2] with f (1.5) = .13. Continuing in this fashion we make estimates of the probability of X being in each of the ten intervals. Now use these to estimate the probability that X is less than 5 by accumulating the probabilities of the intervals that would have X less than 5. Thus we estimate One way to visualize this example is to use the density function value for the height of a rectangle with a unit base. Then the region in the plane above the interval [0,10} has a total area of one square unit. Assuming the distribution is uniform for each interval allows us to see the probability that X < A as the area of the region above the X axis and bounded by the vertical lines, X = 0 and X = A. |
|
 |