Section IN Quadratic Functions
Introduction: Of all the functions that are studied, after linear functions. the simplest and most common class of functions is the class of quadratic functions. These functions are characterized by the operations: squaring a number. multiplication by a constant and addition of a constant.
For example, the function defined by assigning the
value $f(x) =x^2 - 2x - 3$ to the number $x$, also
represented symbolically as $f: x \rightarrow x^2 - 2x -
3$ , or verbally by saying "to find
$f(x)$, square $x$, subtract $2$ times $x$ and
finally subtract $3$", is described as a quadratic
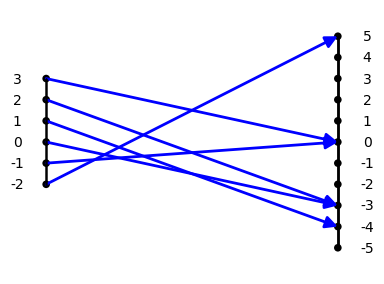
function. This function is visualized by
the mapping diagram, QF1.

Mapping Diagram QF1
This section will provide examples, explanations, exercises and problems that will help students use the power of the mapping diagram along with the three other tools (equations, tables , and graphs) to understand quadratic functions.
Quadratic Function Definition
QF.QFIQuadratic Functions are Important.
This example presents the quadratic function $f(x) = x^2 - 2x - 3$ with a table of data, a graph and a mapping diagram. The "quadratic coefficient" is $1$, the "linear coefficient"i s $-2$, and the "constant " is $-3$.
Treatment of quadratic functions and their graphical interpretation with parabolas and equations are familiar. [See wikipedia.org/wiki : Quadratic_function]
They appear in every textbook that deals at all with intermediate algebra and coordinate geometry- from algebra II to beginning calculus. What is missing is a balanced treatment using mapping diagrams to reinforce the function aspect of visualization. That will be emphasis of this section.
Comparisons will be made when appropriate to graphs- but we will develop the basic concepts for quadratic functions with mapping diagrams. The end of this section includes some powerful and different ways to think about quadratic functions and the ways they are represented algebraically.