| Area:We turn our attention to the concept of area, noting initially that the area of a rectangle is determined as the product of the measurements of the base and the altitude. For a positive function f we can estimate the area of the region enclosed by the graph of the function, the X- axis, the lines X=A and X=B (with A < B) using the area of a rectangle. The rectangle has its base the segment on the X-axis between A and B and its height of length f(A). The area is then estimated by f(A) times (B-A). See Figure IV.F. iii. | 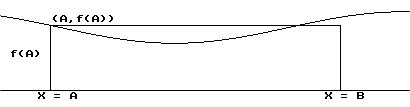 |
| If we cut the segment from A to B into
smaller segments, each of the same length, dx, we can then consider the
areas of the smaller regions that lie above these smaller segments. We
still use rectangles to estimate the areas of these smaller regions, but
now we must add the estimates to obtain an estimate of the area for the
larger region. If we systematically accumulate the areas of the smaller
regions, moving along the number line segment by segment, we find that
at each step we are adding f(something) times dx to the previous
sum. Thus we encounter a process of approximation that is essentially Euler's
method, as the next example illuminates further.
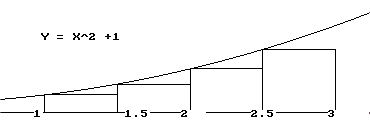
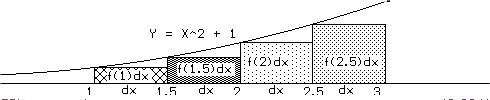
EXAMPLE IV.F.2: Estimate the area of the region enclosed by the X-axis, the lines X=1, X=3, and the graph of Y=X 2+1 using Figure IV.F.iv. SOLUTION: We let A(t) be the area of the region enclosed by the X - axis, the lines X = 1, X = t, and the graph of Y = f(X) = X 2+1 when t >1. Then following the previous ideas, we have or A(t + dx)≈ A(t) + f(t)dx. See Figure IV.F.v.
|
  |
||||||||||||||||||||||||
Thus we can compute the estimates with
dx =.5 as follows: [See Figure IV.F.iv.a]
A(1) = 0 (Given) |
|

What generalizes this method for estimating
the area of the region enclosed by the graph of a positive continuous function,
the X-axis and two vertical lines? The process is a little simpler
than Euler's method because we don't need to keep track of the values of
the areas as they accumulate. As we describe this method below, keep in
mind the examples we have just completed.
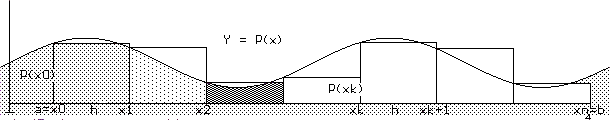
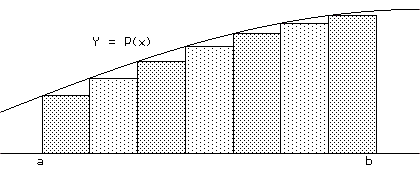
| First, suppose that we want to estimate
the area A of the region enclosed by the graph of a positive continuous
function Y = P(x), the X - axis, and the lines X = a and X = b. We choose
a value for the number of segments of equal length used in the approximation
which we denote by N. Then the length of the segments is denoted h or
dx = (b-a)/N.
We let x 1 = a + dx. We continue by letting x 2 = x 1 + dx [= a + 2dx]. In general (see Figure IV.F.va) we let x k+1 = x k + dx [= a + (k+1)dx], and thus x N = a + Ndx = a + N (b-a)/N = b. For convenience we denote a = x 0. |
 |
| EXAMPLE IV.F.3: Estimate the area
of the region in the plane enclosed by the X-axis, the
lines X =1 and X = 5 and the graph of Y = x 2 + x
using Euler's method with N = 4.
Solution: Since N = 4, dx = h = (5 - 1)/4 = 1. In the notation just discussed we have Thus we have A≈ [P(x 0)+P(x 1)+P(x 2)+P(x 3)] . h. So A≈ [ 2 + 6 + 12 + 20 ] . 1 = 40. |
|
Comments: A more accurate estimate of the area might be found by choosing a larger value for N (more intervals) with a resulting shorter line segment for dx. Larger values of N will diminish the size of the corresponding values of dx = h in the calculations. Of course, when N is very large the number of summands and calculations needed for the estimate becomes unwieldy without either a calculator or a computer. But, with appropriate technology available, much greater precision can be obtained in the estimation. As usual we are interested in whether estimate is larger or smaller than the exact area as well as its (relative) precision.
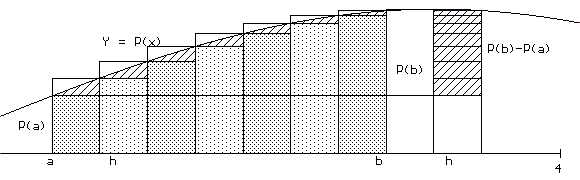
From Figure IV.F.vii it should be apparent that if P is an increasing function on the interval [a,b] then the approximation for the area from Euler's method as just outlined will be an underestimate. Similarly, if P is a decreasing function then the approximation will be an overestimate.
Furthermore if P is increasing on the interval [a,b], the difference between the actual area and the estimate obtained by Euler's method is no greater than [P(b)-P(a)].dx.
See Figure IV.F.viii.
A similar statement can be made if P is decreasing on [a,b].
Example IV.F.3 (Continued). On the interval [1,5], P'(t)=2t + 1 is positive, so P(t) = t2 + t is increasing on this interval. We have already found that P(1) = 2 while P(5) = 30. Using N=4 (and therefore dx = h = 1) for our estimate with Euler's method could have resulted in an underestimate by at most (P(5) - P(1)) (1) = 30 - 2 = 28.
You may be thinking at this time, this is not very accurate. To get an estimate that would be guaranteed to be within 1/10 of a square unit of the actual area using Euler's method and our analysis so far, we would have to choose N so that 4/N = h was small enough to make 28h less than 1/10 . That is 28h = 28 4/N < 1/10. Thus we would have to choose a value for N > 4 (28)(10). So any N > 1120 would lead to an estimate for the area that was at most only 1/10 smaller than the area.
This amount of computation is more than
you might want to do by hand for the desired accuracy. [In fact a smaller
n would do for the same amount of precision. See the excercises.] Here
is one place where a computer or a programmable calculator calculator would
be helpful. Using a computer with N =1200, the estimate is approximately
53.28, so the actual area should be roughly between 53.28 and 53.38.
|
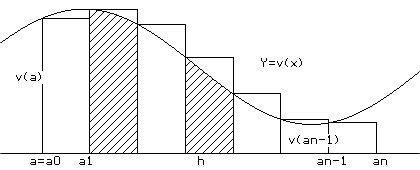
Suppose we are trying to solve the differential equation for the position S(x) of a moving object at time x when the velocity at time x is given by S'(x) = P(x) for some continuous function P, and we are given that the position at x = a
is S(a).
[We are given an initial position and the velocity.]
Since the velocity is a function of the time only, Euler's method gives a rather easy estimate for the position at x = b where a < b. Letting h = (b-a)/N and a k = a + k h, we obtain the estimate S(b) ≈
S(a)
+ P(a 0)h + ... + P(a N-1)h.
This estimate allows us to estimate the change
in the position for the time interval [a,b]. We can find a reasonable estimate
for the change in position by accumulating the estimated changes for short
time steps of size h, that is
S(b) - S(a) ≈ P(a
0)h + ... + P(a N-1)h
Figure IV.F.ix visualizes these relations.
|
Suppose we are trying to solve the differential equation for the cost C(x) of producing x units when the marginal cost at production level x is given by C'(x) = P(x) for some continuous function P, and we are given that the
cost at x = a is C(a).
[We are given a fixed cost
and the rate at which the cost is changing.] Since the marginal cost is a function of the level of production alone, Euler's method gives a rather easy estimate for the cost at x = b where a < b. Letting h = (b-a)/N and a k = a + k h, we obtain the estimate C(b) ≈
C(a)
+ P(a 0)h + ... + P(a N-1)h.
This estimate allows us to estimate the change
in the production costs for the production interval [a,b].
We can find a reasonable estimate for the change in cost by accumulating
the estimated changes for short production steps of size h, that
isC(b) - C(a) ≈
P(a
0)h + ... + P(a N-1)h .
|
Area Interpretation: When P(x)>0,
the suggested "area" interpretation treats this last sum as an estimate
of the area of the region enclosed by the graph of P(x), the lines
X=a, X=b, and the X-axis. (See Figure IV.F.x.) Thus if we
let A denote the region's area, we have that
 By taking n very large (sometimes written
n>>0)
and thinking of the motion interpretation, we find that the estimating
sums must be very close to change in position, S(b) - S(a)
where S'(x) = P(x) for x in [a,b]. But
from the area interpretation when N>>0 these sums are estimates for the
area of the region A.
|
Area Interpretation: When P(x)>0,
the suggested "area" interpretation treats this last sum as an estimate
of the area of the region enclosed by the graph of P(x), the lines
X=a, X=b, and the X-axis. (See Figure IV.F.x.) Thus if we let A denote
the region's area, we have that
By taking n very large (sometimes written
n>>0)
and thinking of the cost interpretation, we find that the estimating
sums must be very close to change in cost, C(b) - C(a) where
C'(x) = P(x) for x in [a,b]. But from the
area interpretation when N>>0 these sums are estimates for the area of
the region A.
|
The following theorem summarizes the analysis
we have made leading to a method for finding an area of a region in the
plane using Euler's method with velocity or marginal costs interpretations
.
i) P is a positive function continuous on [a,b] andLet A be the area of the region enclosed by the graph of P(x), the lines X=a, X=b, and the X-axis
ii) F is continuous function on the interval with F'(x) = P(x) for all x in [a,b].
Then A = F(b) - F(a).
Comment: Because Theorem IV.3 shows a relation between the derivative of a function and the estimated and exact area of a planar region it is sometimes described as a form of the Fundamental Theorem of Calculus. We will see a more general form of this theorem in Chapter V, called "the evaluation form of the Fundamental Theorem of Calculus."
Example IV.F.4 : Find the area of the region in the plane enclosed by the X- axis, the lines X=1, X=5, and the graph of Y=X 2 +X.
Solution: By applying Theorem IV.3 to the problem, the area of this region is equal to F(5)-F(1) where F'(x) = P(x) = x 2 + x. But it is easy to see that a solution to this differential equation is
F(x) = x 3/3 +
x
2/2 + K where K is some constant.
Thus the area of the region is F(5)-F(1)
= (53/3 + 52/2 + K) - ( 1 3/3 +
1 2/2 + K) = 53 1/3.
|
Martin Flashman, 10 June 2014, Created with GeoGebra |
In problems 1 through 6, use Euler's method
with N = 4 (visualized by rectangles) to estimate the area of the region
enclosed by the X-axis, the lines X = 1, X = 5 and the graph of P is given.
Draw a figure that illustrates the rectangles used in your estimation.
Discuss the accuracy of your estimates.
| 1. a. P = 3x | b. P = 3/x |
| 2. a. P = 5x | b. P = 5/x |
| 3. a. P = x 2 | b. P = x-2 |
| 4. a. P = 50 - x 2 | b. P = 50 - x-2 |
| 5. a. P = 1 + x 2 | b. P = 1/(1 + x 2) |
| 6. a. P = x 2 + x | b. P =1/(x 2 + x) |
13.-18. For the functions in problems 1 through 6, discuss the use Theorem IV.3 to find the area of the region enclosed by the X-axis, the graph of the function and the lines X = 1 and X = 5. When possible find the area using the theorem. [Comment: At this stage you may find it difficult or impossible to apply this theorem because it is difficult or impossible to find a suitable indefinite integral for P.]
19-24. For the functions in problems 1 through 6, when possible, use Theorem IV.3 to find the area of the region enclosed by the X-axis, the graph of the function and the lines X = 1 and X = 3. [Comment: At this stage you may find it difficult or impossible to apply this theorem because it is difficult or impossible to find a suitable indefinite integral for P.]
25. Sketch a graph of the region enclosed by the X - axis, the lines X = 1, X = 2 and the graph of Y = x 2. Use Euler's method with N = 4 to estimate the area of the region. Discuss the accuracy of your estimate. Find the area of the region using Theorem IV.3.
26. Sketch a graph of the region enclosed by the X-axis, the lines X = 1/2, X=1 and the graph of Y = x 2. Use Euler's method with N = 4 to estimate the area of the region. Discuss the accuracy of your estimate. Find the area of the region using Theorem IV.3.
27. [Uses ln(x)] Sketch a graph of the region enclosed by the X - axis, the lines X = 1, X = 2 and the graph of Y = 1/x. Use Euler's method with N = 4 to estimate the area of the region. Discuss the accuracy of your estimate. Find the area of the region using Theorem IV.3.
28.[Uses ln(x)] Sketch a graph of the region enclosed by the X-axis, the lines X = 1/2, X=1 and the graph of Y = 1/x. Use Euler's method with N = 4 to estimate the area of the region. Discuss the accuracy of your estimate. Find the area of the region using Theorem IV.3.
29. Find the value of t so that the area of the region enclosed by the X-axis, the line X =1, the line X = t (with t>1), and the graph of Y = 3 X 2 is 4.
30. Suppose F'(t) = G'(t) for all t. Prove F(b)-F(a) = G(b)-G(a) for any a and b. [Hint: Use Theorem IV.2.]
31. Give an argument based on Figure IV.F.viii to justify the statement that if P is positive continuous function increasing on the interval [a,b], then the difference between the actual area and the estimate obtained by Euler's method is no greater than [P(b) - P(a)] .h .
32. Draw a figure and give an argument based on your figure to justify the statement that if P is a positive continuous function decreasing on the interval [a,b], then the difference between the actual area of the region enclosed by the X-axis, the lines X = a and X = b and the graph of Y = P(x) and the estimate obtained by Euler's method is no larger than [P(a) - P(b)] .h.
33. Justify the following statements:
a.The difference between the actual area of the region enclosedby the X-axis, the Y-axis, the line X=1 and the graph of Y=1/(X+1) and the estimate for that area obtained by Euler's method when N = 10 is no larger than 1/20.
b.The difference between the actual area of the region enclosed by the X-axis, the Y-axis, the line X=1 and the graph of Y=1/(X 2+1) and the estimate for that area obtained by Euler's method when N = 10 is no larger than 1/20.
34. Find a value of k so that the difference between the actual area of the region enclosed by the X-axis, the Y-axis, the line X=1 and the graph of Y=1/(X +1) and the estimate for that area obtained by Euler's method for N = k is no larger than 1/1000 .
35. Find the value of k so that the difference between the actual area of the region enclosed by the X-axis, the Y-axis, the line X = 1 and the graph of Y = 1/(X+1) and the estimate for that area obtained by Euler's method for N = k is no larger than 10-6 .
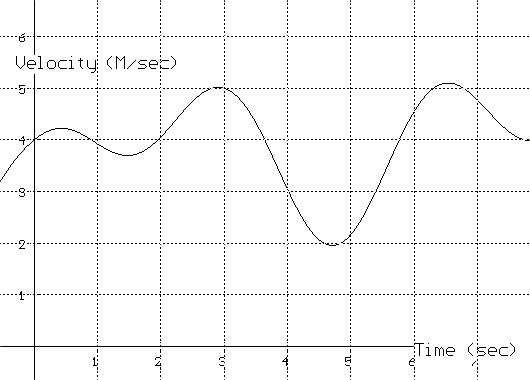
36. Suppose the graph in Figure IV.F.xii gives the velocity of a runner in meters per second. If the runner's position after 1 second is 6 meters, estimate the runner's position after 5 seconds using Euler's method with N = 4. Discuss the relation of the runner's position to area.
37. Project: Interpreting Probability with Area.
Recall that the derivative of a probability distribution function for a random variable X is called a probability density function. Consider the dart throwing example of chapter I.C, where the distribution function was given by F(A) = A 2 for A in [0,1] and the density function was given by f(A) = 2A for A in [0,1).
We saw in Chapter I.C that the probability that A<X<B was determined by B 2 - A 2 = F(B) - F(A).
a) Discuss why the probability that A<X<B could be estimated by 2A times (B-A) when B is close to A.
b) Discuss why the probability that A<X<B could be estimated in N steps by partitioning the interval [A,B] into N segments of equal length and then accumulating the probabilities of X being in those segments using the idea of approximation in part a).
c) Draw a figure to illustrate how the probability that A<X<B could be estimated by summing the area of rectangles related to the graph of the probability density function f (A) = 2A.
d) Explain why the probability that A<X<B can be found by finding the area of the region between X = A, X = B, the X-axis, and the graph of the density function Y = f (X) = 2X.
e) Does this make sense in light of Theorem IV.3? Can you generalize the dart example? Explain and justify your generalization.
38. Project: Investment rates and return on investment. Suppose that investment rates of return vary over a 5 year period. Give an interpretation of the area under the graph of the investment rate in terms of the return on an investment of $1000 over the entire five years of the investment.
39. Project: Concavity and errors in estimating
area.
Suppose that P is an increasing positive
function on [A,B] and the graph of P is concave up for this interval.
a) Draw a figure for this situation and
explain why the difference between P(A) [B-A] and the actual area of the
region enclosed by the X-axis, the lines X = A and X = B and the graph
of P and is no more than 1/2[ P(B) - P(A)][B-A].
b) Use part a) to explain why the difference
between the actual area of the region and the estimate of the area using
Euler's method with N segments of equal length will be no more than
[P(B) - P(A)][B-A]/[2N].
c) Use part b) to explain why using N = 561 would be adequate to estimate the area in Example IV.F.3 to within 1/10.
d) Discuss the quality of estimates for decreasing functions that are concave down.
40. Develop a formula for estimating the area of the region enclosed by the X-axis, the lines X = A and X = B, and the graph of a positive valued continuous function based on the use of the value of the function at the right hand endpoint. Draw figures to visualize this situation. Discuss the quality of the estimate in situations when the graph of the function is increasing, decreasing, concave down and concave up.
41. Develop a formula for estimating the area of the region enclosed by the X-axis, the lines X = A and X = B, and the graph of a positive valued continuous function based on the use of the value of the function at the midpoint. Draw figures to visualize this situation. Discuss the quality of the estimate in situations when the graph of the function is increasing, decreasing, concave down and concave up.
