For example, the context of a marsh land environment is familiar to many residents of Arcata. Suppose that water is flowing from a stream into a marsh for 5 hours at 30000 cubic feet per hour. What change might be expected in the amount of water in the marsh and in the height of the water along an embankment at the end of the five hours. It should seem reasonable to you that after five hours the marsh will contain an additional 150000 cubic feet of water. We need more information about the shape of the marsh to determine the change in the height along the embankment. In particular we would need more information about the surface area of the marsh and the grade (steepness) of the embankment. We would also want to know how fast the water is flowing out of the marsh.
Describe a context in a similar fashion related to the following three settings. Indicate some of the important variables and rates that would be of interest for this context. Discuss how knowing these rates can be used to determine other information related to the original variables.
1. Automobile and truck traffic on Highway 101 or at major traffic
intersection.
2. A flu epidemic in a population of school children. (Consider
Susceptible, Infected, and Recovered members of the population.)
3. A college class room. (You might consider such variables
as number of people present, temperature, or level of sound.)
Extension or Substitute for one of the above: Describe a context
related to a setting connected to your major or some personal interest.
- If we have any two regions on the board of equal area then the dart would land in those regions about the same number of times with a large number of throws.
(a) If the board is divided into two regions by a concentric circle of radius 30 and I repeat the experiment a large number of times, what proportion of markings from the experiment is likely to lie in the inner region? See Figure 1.
(b) If the board is divided into four regions by concentric circles of radius 15, 30, and 45 cm and I repeat the experiment a large number of times, what proportion of the markings from the experiments is likely to lie in each of the regions?
(c) If the board is divided into n regions by concentric circles of radius k * 60/n cms with k = 1,2 ... n-1, and I repeat the experiment a large number of times, what proportion of the markings from the experiments is likely in each of the regions?
We allow a player to throw a dart 36 times and find the total score for the player as well as the average score (the total divided by 36). Notice the average will be a number between 5 and 55. Give a total score and an average that are likely for a player with no special skill. [These numbers are described as the expected score and the expected average for the game.] Discuss your reasoning and show the work leading to your proposed solution.
Suggestion: You might investigate the similar problem with 2 regions and 4 throws and then 4 regions and 16 throws as a way to begin thinking about the problem. How many darts do you think would fall in each region?
Extension: (Optional) If we measure the distance each of the
36 darts fall from the center, what do you think the average distance would
be for a player with no special skills. Explain your reasoning, any
connections with the expected average score in the game, and whether you
have any belief about the accuracy of your response. (Is it an underestimate
or an overestimate?)
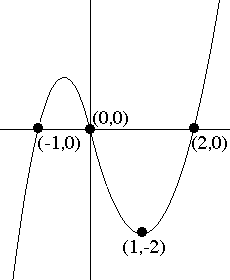
One way to make a curve that passes through several points and looks smooth is to draw several curves that are defined by a small number of points and make sure that when the curves are joined together they have the same tangent lines, making

A. Use two curves defined by quadratic functions to make a single smooth curve that passes through the four points, (-1,0), (0,0), (1,-2) and (2,0) as in the figure. Discuss briefly the strategy you used to find your solution.
Suggestion: Let![]() and
and ![]() . Have
the pair of curves meet at (0,0).
. Have
the pair of curves meet at (0,0).
B. Find a second pair of quadratic polynomials which can be used to make a single smooth curve that passes through the same four points.
C. Find a single cubic polynomial that passes through the same four points.
D. Use some technology to sketch your solutions for A,B, and C. Discuss briefly any noticeable differences (such as "vertices") between the three curves.
E. Find a cubic and a quadratic polynomial that can be used to make
a single smooth curve that passes through the five points (-2,0), (-1,0),
(0,0), (1,-2) and (2,0).